Difference between revisions of "Sanborn Maps"
m (→1903) |
|||
| Line 1: | Line 1: | ||
The '''Sanborn Maps''' were a series of maps of urbanized areas created by the '''Sanborn Map Company''' in the late-nineteenth and early-twentieth centuries. They were used primarily by fire insurance agents to determine the degree of damage to a property and show accurate information to help them determine risks and establish premiums. The maps also described the status of local fire departments, water facilities, sprinklers, hydrants, cisterns, and alarm boxes as well as firewalls, windows, doors, elevators and chimneys and roof types. Because of their thoroughness and attention to detail, the maps have been praised by modern historians for providing "a guide to American urbanization that is unrivaled by other cartography and, for that matter, by few documentary resources of any kind."<ref>Keister, Kim. 1993. “Charts of Change.” Historic Preservation, vol. 45 no. 3. May/June pp. 42-49.</ref> | The '''Sanborn Maps''' were a series of maps of urbanized areas created by the '''Sanborn Map Company''' in the late-nineteenth and early-twentieth centuries. They were used primarily by fire insurance agents to determine the degree of damage to a property and show accurate information to help them determine risks and establish premiums. The maps also described the status of local fire departments, water facilities, sprinklers, hydrants, cisterns, and alarm boxes as well as firewalls, windows, doors, elevators and chimneys and roof types. Because of their thoroughness and attention to detail, the maps have been praised by modern historians for providing "a guide to American urbanization that is unrivaled by other cartography and, for that matter, by few documentary resources of any kind."<ref>Keister, Kim. 1993. “Charts of Change.” Historic Preservation, vol. 45 no. 3. May/June pp. 42-49.</ref> | ||
| + | |||
| + | ==1884== | ||
| + | <imagemap> | ||
| + | Image:Sanborn1884-index.jpg|right|350px|Sanborn Map, 1884 | ||
| + | |||
| + | rect 550 153 612 205 [[Image:Sanborn1884-1.jpg|1]] | ||
| + | rect 731 125 937 177 [[Image:Sanborn1884-1.jpg|1]] | ||
| + | rect 119 532 339 745 [[Image:Sanborn1884-2.jpg|2]] | ||
| + | rect 258 276 475 527 [[Image:Sanborn1884-3.jpg|3]] | ||
| + | rect 592 221 683 293 [[Image:Sanborn1884-4.jpg|4]] | ||
| + | poly 482 285 474 529 695 532 696 459 581 458 579 291 [[Image:Sanborn1884-4.jpg|4]] | ||
| + | rect 711 427 815 701 [[Image:Sanborn1884-5.jpg|5]] | ||
| + | rect 1006 548 1099 613 [[Image:Sanborn1884-5.jpg|5]] | ||
| + | rect 534 543 688 779 [[Image:Sanborn1884-6.jpg|6]] | ||
| + | rect 361 539 520 741 [[Image:Sanborn1884-7.jpg|7]] | ||
| + | rect 311 756 529 1015 [[Image:Sanborn1884-7.jpg|7]] | ||
| + | rect 436 1019 519 1089 [[Image:Sanborn1884-4.jpg|4]] | ||
| + | |||
| + | desc bottom-left | ||
| + | </imagemap> | ||
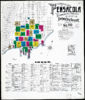
| + | The September [[1884]] map gives the following information about Pensacola: | ||
| + | :''Population, 10,000. Prevailing Winds S.W. in Summer, N. in Winter.'' | ||
| + | :''2 Steam Fire Engines, 1 Hook & Ladder Co. 2000 Ft. of Hose, One Hundred & Fifty Firemen, Volunteer.'' | ||
| + | :''Water Facilities, Bay, Streams, Cisterns & Private Tanks.'' | ||
| + | ===Notes=== | ||
| + | {{sectstub}} | ||
| + | <gallery perrow="5" widths="85" heights="100"> | ||
| + | Image:Sanborn1884-1.jpg|1 | ||
| + | Image:Sanborn1884-2.jpg|2 | ||
| + | Image:Sanborn1884-3.jpg|3 | ||
| + | Image:Sanborn1884-4.jpg|4 | ||
| + | Image:Sanborn1884-5.jpg|5 | ||
| + | Image:Sanborn1884-6.jpg|6 | ||
| + | Image:Sanborn1884-7.jpg|7 | ||
| + | Image:Sanborn1884-8.jpg|8 | ||
| + | Image:Sanborn1884-9.jpg|9 | ||
| + | Image:Sanborn1884-10.jpg|10 | ||
| + | </gallery> | ||
==1903== | ==1903== | ||
Revision as of 15:28, 28 March 2009
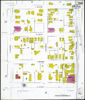
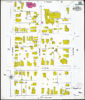
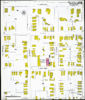
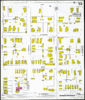
The Sanborn Maps were a series of maps of urbanized areas created by the Sanborn Map Company in the late-nineteenth and early-twentieth centuries. They were used primarily by fire insurance agents to determine the degree of damage to a property and show accurate information to help them determine risks and establish premiums. The maps also described the status of local fire departments, water facilities, sprinklers, hydrants, cisterns, and alarm boxes as well as firewalls, windows, doors, elevators and chimneys and roof types. Because of their thoroughness and attention to detail, the maps have been praised by modern historians for providing "a guide to American urbanization that is unrivaled by other cartography and, for that matter, by few documentary resources of any kind."[1]
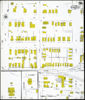
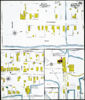
1884
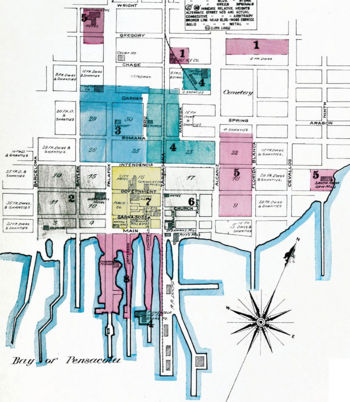

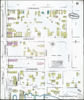
The September 1884 map gives the following information about Pensacola:
- Population, 10,000. Prevailing Winds S.W. in Summer, N. in Winter.
- 2 Steam Fire Engines, 1 Hook & Ladder Co. 2000 Ft. of Hose, One Hundred & Fifty Firemen, Volunteer.
- Water Facilities, Bay, Streams, Cisterns & Private Tanks.
Notes
| This section is a stub. You can help by expanding it. |
1

2
3
4

5
6

7
8

9
10


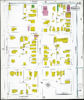
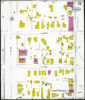
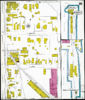
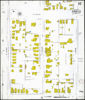
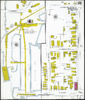
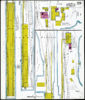
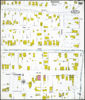
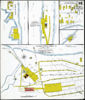
1903
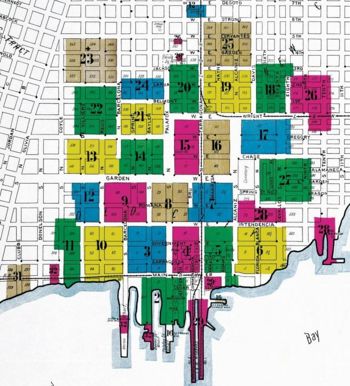

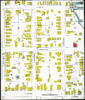
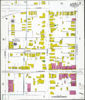
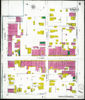
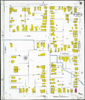
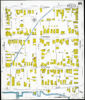
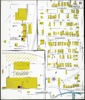
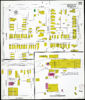
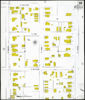
The May 1903 map gives the following information about Pensacola:
- Population 22,000
- Prevailing Winds, S.W. in Summer, N. in Winter
- Water Facilities Pensacola Water Co. Gravity and direct pressure system. Water supply from 14-4" and 4-6" driven wells, capacity 9000 galls. each per hour. 20 Miles of water pipes, 6", 12" & 14" diam. 193 Double hydrants. Gravity pressure 80 lbs. direct pressure 150 lbs. per sq. inch.
- Water pumped to iron stand pipe capacity 325,000 galls. 137 ft high. by two Deane duplex pumps, cap'y 2 million galls each per 24 hours.
- Two storage reservoirs at pumping station, capacity 300,000 galls. each.
- Fire Department, Paid. 28 Men. Gamewell fire alarm system, 34 boxes.
- Four hose carts. 750 ft 2½" hose to each.
- One hook & ladder truck.
- One 3d class Silsby steam fire engine.
- 3500 ft. 2½" hose in good condition.
- Grades nearly level throughout town.
Notes
- The index map incorrectly shows Tarragona Street as the divider of east-west streets, instead of Palafox. Interior sheets show the correct addresses, however.
| This section is a stub. You can help by expanding it. |
1

2
3
4
5
6
7
8
9
10
11
12
13
14
15
16
17

18

19
20
21

22
23

24
25
26

27
28
29
30 (Warrington)
31
32


External links & references
- ↑ Keister, Kim. 1993. “Charts of Change.” Historic Preservation, vol. 45 no. 3. May/June pp. 42-49.