Difference between revisions of "Sanborn Maps"
m (Sanborn Fire Maps moved to Sanborn Maps) |
|||
| Line 2: | Line 2: | ||
==1903== | ==1903== | ||
| − | [[Image:Sanborn1903- | + | <imagemap> |
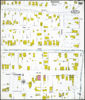
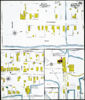
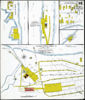
| + | Image:Sanborn1903-index.jpg|right|350px|Sanborn Map, 1903 | ||
| + | |||
| + | rect 342 601 342 599 [[Image:Sanborn1903-2.jpg|2]] | ||
| + | rect 236 418 306 503 [[Image:Sanborn1903-3.jpg|3]] | ||
| + | rect 319 419 369 503 [[Image:Sanborn1903-4.jpg|4]] | ||
| + | rect 378 419 431 508 [[Image:Sanborn1903-5.jpg|5]] | ||
| + | rect 437 420 530 506 [[Image:Sanborn1903-6.jpg|6]] | ||
| + | rect 348 338 430 408 [[Image:Sanborn1903-7.jpg|7]] | ||
| + | rect 279 338 348 409 [[Image:Sanborn1903-8.jpg|8]] | ||
| + | rect 192 337 270 410 [[Image:Sanborn1903-9.jpg|9]] | ||
| + | rect 153 419 226 521 [[Image:Sanborn1903-10.jpg|10]] | ||
| + | poly 101 405 99 460 116 462 117 531 147 523 148 419 138 420 137 405 [[Image:Sanborn1903-11.jpg|11]] | ||
| + | poly 132 338 181 338 183 409 138 410 134 370 [[Image:Sanborn1903-12.jpg|12]] | ||
| + | rect 123 258 219 321 [[Image:Sanborn1903-13.jpg|13]] | ||
| + | rect 220 256 302 321 [[Image:Sanborn1903-14.jpg|14]] | ||
| + | rect 322 220 369 322 [[Image:Sanborn1903-15.jpg|15]] | ||
| + | rect 375 222 426 322 [[Image:Sanborn1903-16.jpg|16]] | ||
| + | rect 445 221 538 285 [[Image:Sanborn1903-17.jpg|17]] | ||
| + | poly 473 118 543 117 543 137 530 141 528 207 474 208 [[Image:Sanborn1903-18.jpg|18]] | ||
| + | rect 376 129 463 206 [[Image:Sanborn1903-19.jpg|19]] | ||
| + | rect 312 119 367 208 [[Image:Sanborn1903-20.jpg|20]] | ||
| + | rect 222 190 304 249 [[Image:Sanborn1903-21.jpg|21]] | ||
| + | rect 136 159 215 249 [[Image:Sanborn1903-22.jpg|22]] | ||
| + | rect 120 69 216 152 [[Image:Sanborn1903-23.jpg|23]] | ||
| + | rect 223 144 302 183 [[Image:Sanborn1903-24.jpg|24]] | ||
| + | rect 377 40 463 121 [[Image:Sanborn1903-25.jpg|24]] | ||
| + | poly 537 139 610 139 612 240 571 241 571 209 536 209 [[Image:Sanborn1903-26.jpg|26]] | ||
| + | rect 480 293 576 371 [[Image:Sanborn1903-27.jpg|27]] | ||
| + | poly 439 371 439 411 529 411 528 384 471 387 472 372 [[Image:Sanborn1903-28.jpg|28]] | ||
| + | poly 581 401 620 404 623 490 585 490 [[Image:Sanborn1903-28.jpg|28]] | ||
| + | rect 347 513 409 707 [[Image:Sanborn1903-29.jpg|29]] | ||
| + | rect 321 70 338 113 [[Image:Sanborn1903-26.jpg|26]] | ||
| + | rect 8 489 55 554 [[Image:Sanborn1903-31.jpg|31]] | ||
| + | rect 90 487 110 527 [[Image:Sanborn1903-32.jpg|32]] | ||
| + | rect 263 601 283 646 [[Image:Sanborn1903-32.jpg|32]] | ||
| + | rect 302 602 321 650 [[Image:Sanborn1903-16.jpg|16]] | ||
| + | rect 343 6 381 32 [[Image:Sanborn1903-12.jpg|12]] | ||
| + | rect 394 553 419 564 [[Image:Sanborn1903-16.jpg|16]] | ||
| + | |||
| + | desc bottom-left | ||
| + | </imagemap> | ||
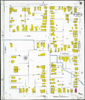
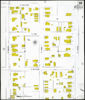
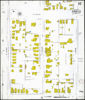
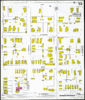
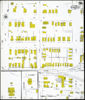
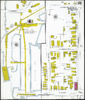
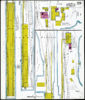
The May [[1903]] map gives the following information about Pensacola: | The May [[1903]] map gives the following information about Pensacola: | ||
:''Population 22,000'' | :''Population 22,000'' | ||
Revision as of 13:22, 28 March 2009
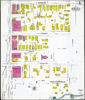
The Sanborn Maps were a series of maps of urbanized areas created by the Sanborn Map Company in the late-nineteenth and early-twentieth centuries. They were used primarily by fire insurance agents to determine the degree of damage to a property and show accurate information to help them determine risks and establish premiums. The maps also described the status of local fire departments, water facilities, sprinklers, hydrants, cisterns, and alarm boxes as well as firewalls, windows, doors, elevators and chimneys and roof types. Because of their thoroughness and attention to detail, the maps have been praised by modern historians for providing "a guide to American urbanization that is unrivaled by other cartography and, for that matter, by few documentary resources of any kind."[1]
1903
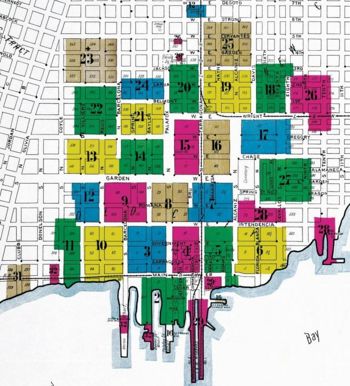

The May 1903 map gives the following information about Pensacola:
- Population 22,000
- Prevailing Winds, S.W. in Summer, N. in Winter
- Water Facilities Pensacola Water Co. Gravity and direct pressure system. Water supply from 14-4" and 4-6" driven wells, capacity 9000 galls. each per hour. 20 Miles of water pipes, 6", 12" & 14" diam. 193 Double hydrants. Gravity pressure 80 lbs. direct pressure 150 lbs. per sq. inch.
- Water pumped to iron stand pipe capacity 325,000 galls. 137 ft high. by two Deane duplex pumps, cap'y 2 million galls each per 24 hours.
- Two storage reservoirs at pumping station, capacity 300,000 galls. each.
- Fire Department, Paid. 28 Men. Gamewell fire alarm system, 34 boxes.
- Four hose carts. 750 ft 2½" hose to each.
- One hook & ladder truck.
- One 3d class Silsby steam fire engine.
- 3500 ft. 2½" hose in good condition.
- Grades nearly level throughout town.
Notes
| This section is a stub. You can help by expanding it. |
1

2
3
4
5
6
7
8
9
10
11
12
13
14
15
16
17

18

19
20
21

22
23

24
25
26

27
28
29
30
31
32


External links & references
- ↑ Keister, Kim. 1993. “Charts of Change.” Historic Preservation, vol. 45 no. 3. May/June pp. 42-49.